- MN ABE Connect
- Archive
- Google Sheets for Data Analysis – Part 1
 February 24, 2025
Google Sheets for Data Analysis – Part 1
Google Sheets
For a very very brief window of time, I was a software developer. Now, I wasn’t a very good software developer, but I learned the secret of all developers: we’re lazy. We try to get the computer to do the work for us, so we can save our brainpower for more important tasks.
![]() Now, I’m not advocating for ABE practitioners to go take cat naps, but I think there’s something to be said for letting the computer do some of the work for us. One of my favorite computer tools is Google Sheets. Google Sheets is an incredibly powerful spreadsheet software that you can leverage to do data analysis for you. (Don’t worry, if you’re a Microsoft team, almost everything I’m doing here can be done in Excel, too.)
Now, I’m not advocating for ABE practitioners to go take cat naps, but I think there’s something to be said for letting the computer do some of the work for us. One of my favorite computer tools is Google Sheets. Google Sheets is an incredibly powerful spreadsheet software that you can leverage to do data analysis for you. (Don’t worry, if you’re a Microsoft team, almost everything I’m doing here can be done in Excel, too.)
If you want to follow along with what I’m doing in this article, you can make a copy of the spreadsheet I’m working from. This is a selection of student demographic data downloaded from SID. (Don’t worry, I ran a program to replace identifying information with fake names, ages, and birthdates.)
Filters
The first tool I’ll demonstrate is filters. Filters in Google Sheets let you show or hide rows based on certain rules, so you can focus on the data you need. I might use filters to find the students in my program that don’t have Social Security Numbers on file – we know we’re always trying to capture as many SSNs as we can, so maybe I want to know who my coordinators can follow up with.
To set filters:
- Highlight the row that you want the filters to appear on. Typically, this is the row with the header information.
- Click on the Data menu, choose Create a filter, and use the filter icons in the column headers to show only the rows you want.
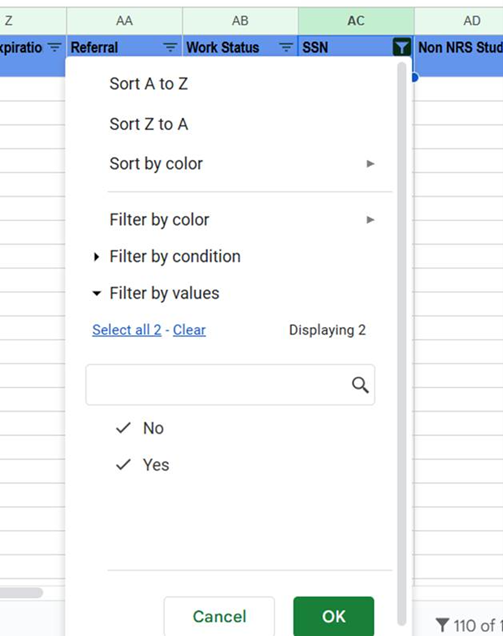
The filter icon looks like this:
When I click the icon, I’m given options to select just the options I want:
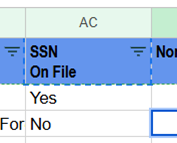
Now, I can choose to see only students without SSN numbers on file.
Functions
A huge set of tools in Google Sheets live in functions. A function in Google Sheets is a built-in command that performs a specific task, like calculations or data manipulation, using the values in your cells. Some common functions are Sum(), Count(), and Average().
To use a function in Google Sheets, type an equals sign (=) in a cell, followed by the function name (e.g., SUM), add parentheses, and include the cells or values you want to use inside the parentheses (e.g., =SUM(A1:A5)), then press Enter.
The simple functions I use most often are:
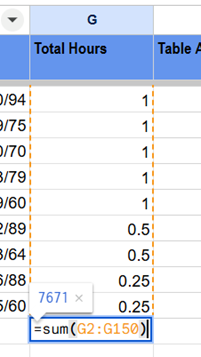
- Sum(): Sum takes in a series of cells and adds the numbers together. Below, I’m asking what is my total number of hours are for all participants in my dataset:
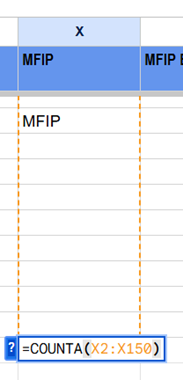
- CountA(): CountA will simply count how many cells have values in them within a range of cells. It doesn’t count blank cells. Since MFIP clients have a designation “MFIP” and non-MFIP clients have blank cells in my dataset, I could use CountA() to see how many of my participants have records of being MFIP clients.
- Average(): Average tells me the average across a range of cells. I might see what my average number of hours are.
- CountUnique(): CountUnique tells me how many unique values I have in the selected range of cells. I could use this to tell me how many different zip codes or languages are represented by my student body.
A few more complicated functions are conditional functions. These are named things like CountIf or SumIf. In these functions, you provide a range of cells, followed by a condition that each cell has to meet. You separate these two items with a comma, and put the condition in quotations.
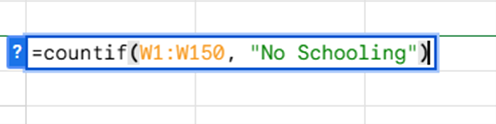
- CountIf(): The COUNTIF function in Google Sheets counts the number of cells in a range that meet a specific condition, like =COUNTIF(A1:A10, “>5”) to count cells greater than 5. I might use this to see how many students have various levels of schooling, starting with counting how many of my participants report no schooling.
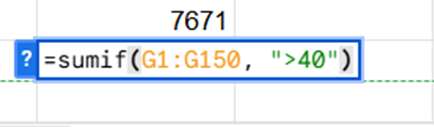
- SumIf(): SumIf() will only perform the sum function on cells that meet a certain criteria – I could find the total number of hours generated by students, but only students that have exceeded 40 hours.